Please Note: An earlier version of this post attributed the blog post discussed below to David Lowery. Subsequently, I have learned that Lowery is not the author of this post. I have revised this piece to remove references to David Lowery, and I sincerely apologize to Mr. Lowery for any misunderstanding.
A recent post on the Trichordist quoted data from the Bureau of Labor and Statistics (BLS) indicating that the number of working musicians has decreased by 45% since 2002. It included the following graphic to illustrate this point:
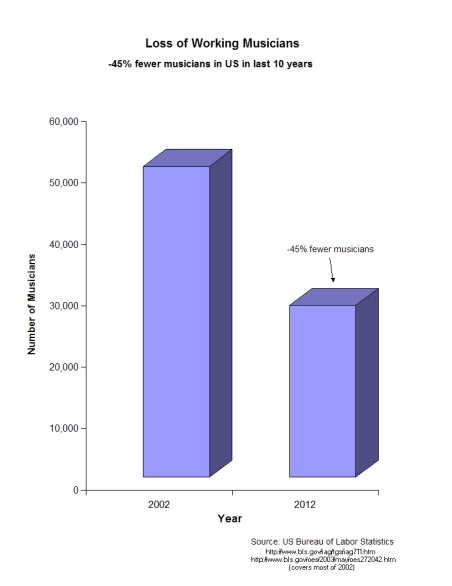
The Trichordist’s statistics seemed shocking. Could they really be right?
An employment drop of 45% in a ten year period is pretty extreme, even given the current state of the music business. Therefore, I thought it might be worth a visit to the BLS website, to dig a little deeper into the Trichordist’s numbers. Fortunately, the Trichordist was kind enough to cite its sources in the image above. Unfortunately, it did not include hot links to these sources in its blog post, and I’m kind of lazy. So rather than hand-typing those links into the brower, I first did a web search on “BLS musicians” to see if that would take me to the right place. I ended up at a page titled “Occupational Outlook Handbook” (http://www.bls.gov/ooh/entertainment-and-sports/musicians-and-singers.htm).
This page did not contain the data that the Trichordist used to make the chart above, but it did indicate the following:
- that there were 176,200 jobs for musicians and singers in 2010.
- that the number of musician and singer jobs was expected to grow 10% by the year 2020.
At this, point, I was getting confused. Why were these numbers different than the Trichordist’s?
Not only were the numbers from the “Occupational Outlook Handbook” completely different (and significantly larger) than the Trichordist’s numbers, they also indicated job growth over the next 10 years, not job shrinkage (which is what the Trichordist had asserted was happening). So I bit the bullet and hand-typed in the links from the Trichordist’s chart above, which are as follows:
http://www.bls.gov/iag/tgs/iag711.htm#about;
http://www.bls.gov/oes/2003/may/oes272042.htm
When I got to those pages, the numbers were the same as those cited by the Trichordist above. But I was still left wondering why the BLS website had more than one set of musician employment numbers.
It turns out that the Trichordist’s numbers and the Occupational Handbook numbers were drawn from different surveys that used different methodologies.
The 176,200 figure comes from the Industry-Occupation Matrix Data, by occupation (the “Matrix”). You can find that here. The Matrix data is further broken down by industry, and you can download the raw data for an industry in .xls spreadsheet format. (The raw data for musicians and singers is available here: ftp://ftp.bls.gov/pub/special.requests/ep/ind-occ.matrix/occxls/occ27-2041.xls.)
The BLS has this to say about where the Matrix numbers came from. The methodology of the Matrix is explained here. This paragraph from that discussion seems particularly instructive (especially the last sentence):
Base-year employment data for wage and salary workers, self-employed workers, and unpaid family workers come from a variety of sources, and measure total employment as a count of jobs, not a count of individual workers. This concept is different from that used by another measure familiar to many readers, the Current Population Survey’s total employment as a count of the number of workers. The Matrix’s total employment concept is also different from the BLS Current Employment Statistics (CES) total employment measure. Although the CES measure is also a count of jobs, it covers nonfarm payroll jobs, whereas the Matrix includes all jobs.
So where do the Trichordist’s Numbers come from and how do they relate to the numbers from the Matrix?
The numbers from the Trichordist’s chart were drawn from the Occupational Employment Statistics program (OES) (http://www.bls.gov/oes/), a data source that seems to share some methodological similarities with the CES (which was referenced in the paragraph above).
The OES FAQ explains the methodology underlying the OES. For our purposes, the most salient information is as follows:
“Employees” are all part-time and full-time workers who are paid a wage or salary. The survey does not cover the self-employed, owners and partners in unincorporated firms, household workers, or unpaid family workers.
It appears that the numbers used in the Trichordist’s chart exclude both self-employed workers and owners of unincorporated firms (i.e., the partners in a partnership or the members of an LLC).
It’s not trivial to omit self-employed workers and owners of incorporated firms. Of the total musician and singer jobs in 2010, the data from the spreadsheet I linked to above indicates that 75,000 (42%) of those jobs stemmed from self-employment. I don’t know about you, but it definitely makes intuitive sense to me that this percentage would be pretty high, as lots of musicians are self-employed/sole proprietors or operating in a partnership or LLC (i.e., an unincorporated association).
Update: In a Facebook comment thread on this blog post, I gave some more concrete examples about common situations for working musicians and how they are captured by the BLS data I looked at. One of the commenters suggested that it would be useful to have it in the main blog post as well. So I’m adding it here.
(a) Let’s say we have a band. They make their entire living from music. The core group is two people. They are organized as a member-managed, LLC with two members. The LLC is taxed as a partnership. They don’t receive a salary. They get their money in the form of distributions from the LLC. This money flows through to each of their 1040s on a k-1 and is treated as self-employment income.
Let’s say that two other musicians also regularly play in this band (perhaps they are the drummer and bass player), but they are not members of the LLC (i.e., they don’t hold equity in the company). These musicians may also pick up work playing gigs with other people when the main band isn’t active. Both in the context of their main band and on any other jobs they do, these musicians get paid as 1099 contractors. So all their income in a year is also from self-employment.
None of these musicians are counted in the OES data the Trichordist has cited, but these musicians are apparently counted in the Matrix data. The scenario above is a very real scenario, especially for the so-called middle class of musicians (i.e., people who are making enough money from playing music to subsist without another job). As the Matrix data shows, the median income of the musicians in their survey was around $22/hr. That works out to a yearly gross income of around $42k (40 hours a week for 48 weeks a year). So half the musicians in the Matrix data made more than that and half made less. I suspect that a lot of full-time musicians in the $20k-$40k range fit the scenario I’ve spelled out above (either co-owner of a partnership or LLC or a sole proprietor receiving living mostly from 1099 contractor income).
(b) Now, let’s think about a more successful band. I don’t know anything about the particulars of Wilco, but I get the sense that Jeff Tweedy is the only equity holder in Wilco, Inc. (or Wilco, LLC). So all the other guys are likely hired guns from a legal and financial standpoint.
In a situation like that, where a band is successful and has more predictable cash-flow, there’s a much better chance that these hired guns won’t be 1099 contractors anymore. Instead, they will be salaried employees of Wilco, Inc., benefits will be paid, exclusivity may be required, etc.
Musicians in the Wilco situation would likely be counted in the OES numbers that the Trichordist cited. And to the extent that the OES numbers say that these kinds of musician jobs have shrunk significantly since 2002, that’s no small thing. For those kinds of jobs are good jobs, and we should all probably be fighting for a world in which there are more jobs like that for musicians. But that’s a different issue than the one the Trichordist has put on the table (i.e., the changing character of musician jobs vs. a change in the absolute number of musician jobs).
Where does that leave us?
I’d love to get a more nuanced picture of things than I have now. Even with the additional info from the Matrix, a lot of important questions remain unanswered. But based on the info I found on the BLS website, I will say this: If the goal is to understand how many working musicians and singers there are over time, the job numbers used must include self-employed workers; otherwise, they aren’t suitable to that task. If we had, say, Matrix data from 2000 that could be compared to the 2010 Matrix data, maybe we would find that the trends in that data are the same as the trends in the OES data that the Trichordist used for its chart.
But absent that sort of data, it seems like the broadest claim one can make based on the OES data is that payroll-based jobs for musicians have shrunk since 2002. However, once we narrow things down to that claim, it significantly muddies the causal link that the Trichordist is trying to make between the rise of digitial music and fall of musician jobs.
The loss of a payroll job doesn’t necessarily mean that the person in question was unable to find a nonpayroll job as a musician. Indeed, a lost payroll job might well be replaced by a new non-payroll job in the economy. Therefore, the absolute number of musician jobs may not have shrunk at all. Instead, it may be that the character of musician jobs has shifted.
Having said that, the loss of payroll-based musician jobs may still be significant. As in other industries, the loss of such a job can mean that a musician is exchanging a job with benefits, etc. for an independent contractor situation, where pay and benefits are not as good. So there may well be economic losses involved. But it seems highly speculative to draw conclusions about the nature or cause of these sorts of economic losses from the BLS data cited in the Trichordist’s blog post.
Perhaps the Trichordist will dig further into this question, find more data, and then share what it has learned with the rest of us.